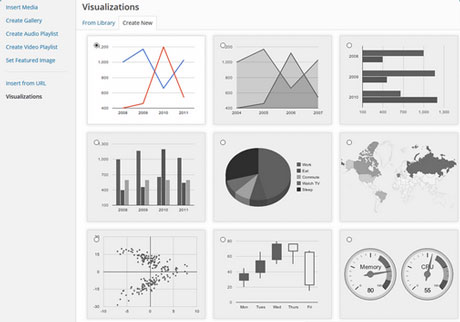

If you run a data-focused website, it makes sense to display interactive charts and attractive graphs on your website. The WordPress Charts and Graphs Plugin is just the plugin for the job. It uses Google’s API to add interactive charts to your website. The free version comes with 9 chart types but the pro version supports even more visuals.


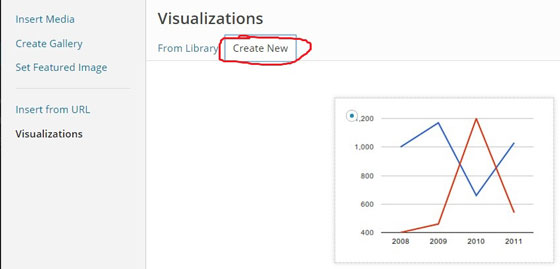
You will be able to create and customize your own charts to have them rendered using HTML5/SVG. Your visitors will be able to explore your charts on all their favorite devices. To create a chart, simply click on Add Media, select Visualizations, and create a new one.


The pro version of the plugin brings Timeline, Table chart, and other chart types to your site. It also lets you import data and edit entries. You can download the free version here.

