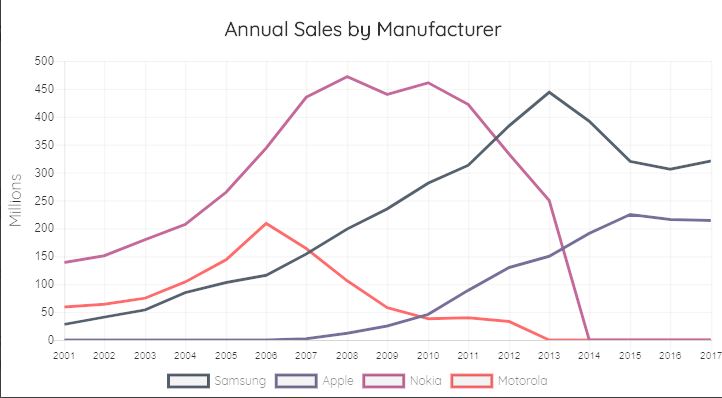

In the past few years, we have covered a whole host of plugins that let you display dynamic charts on your WordPress pages. Chart.js is especially useful for charting data. Here are 5 Chart.js WordPress plugins that let you take advantage of this open source technology to display HTML5 charts on your site:


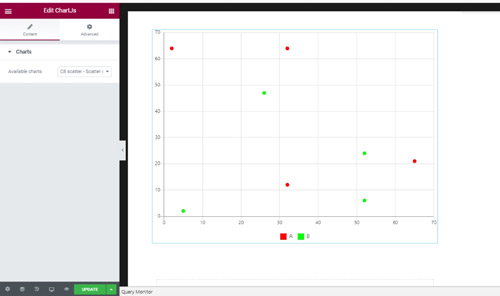
ChartJs: this WordPress plugin supports line, bar, bubble, radar, scatter, and 7 types of charts in total. You can import data from CSV fields. It can grab data from WordPress or a remote server.


Planet Charts: a chart block type for the Gutenberg editor. It supports pie, doughnut, column, bar, line, smooth line, area, radar, and other chart types.


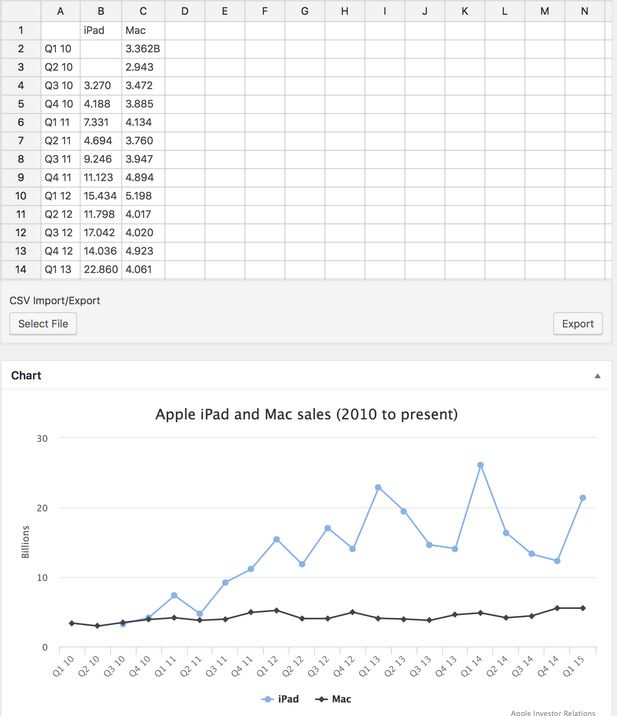
M Chart: lets you chart your data with Chart.js and embed them into your posts with a simple shortcode.
wpDataTables: a table and chart creator for WordPress. It accepts Excel, CSV, PHP, and other data sources. It has an Excel like editor and a responsive mode. Lets you add/remove columns and merge cells. It supports 14 different chart types. It uses Google Charts, Highcharts and Chart.js.
Blazing Charts: lets you use a bunch of popular charting libraries to visualize your data, including HighCharts, Morris, Chart.js, D3.js, and Google Charts.
Have you found better Chart.JS WordPress plugins? Please share them here.
